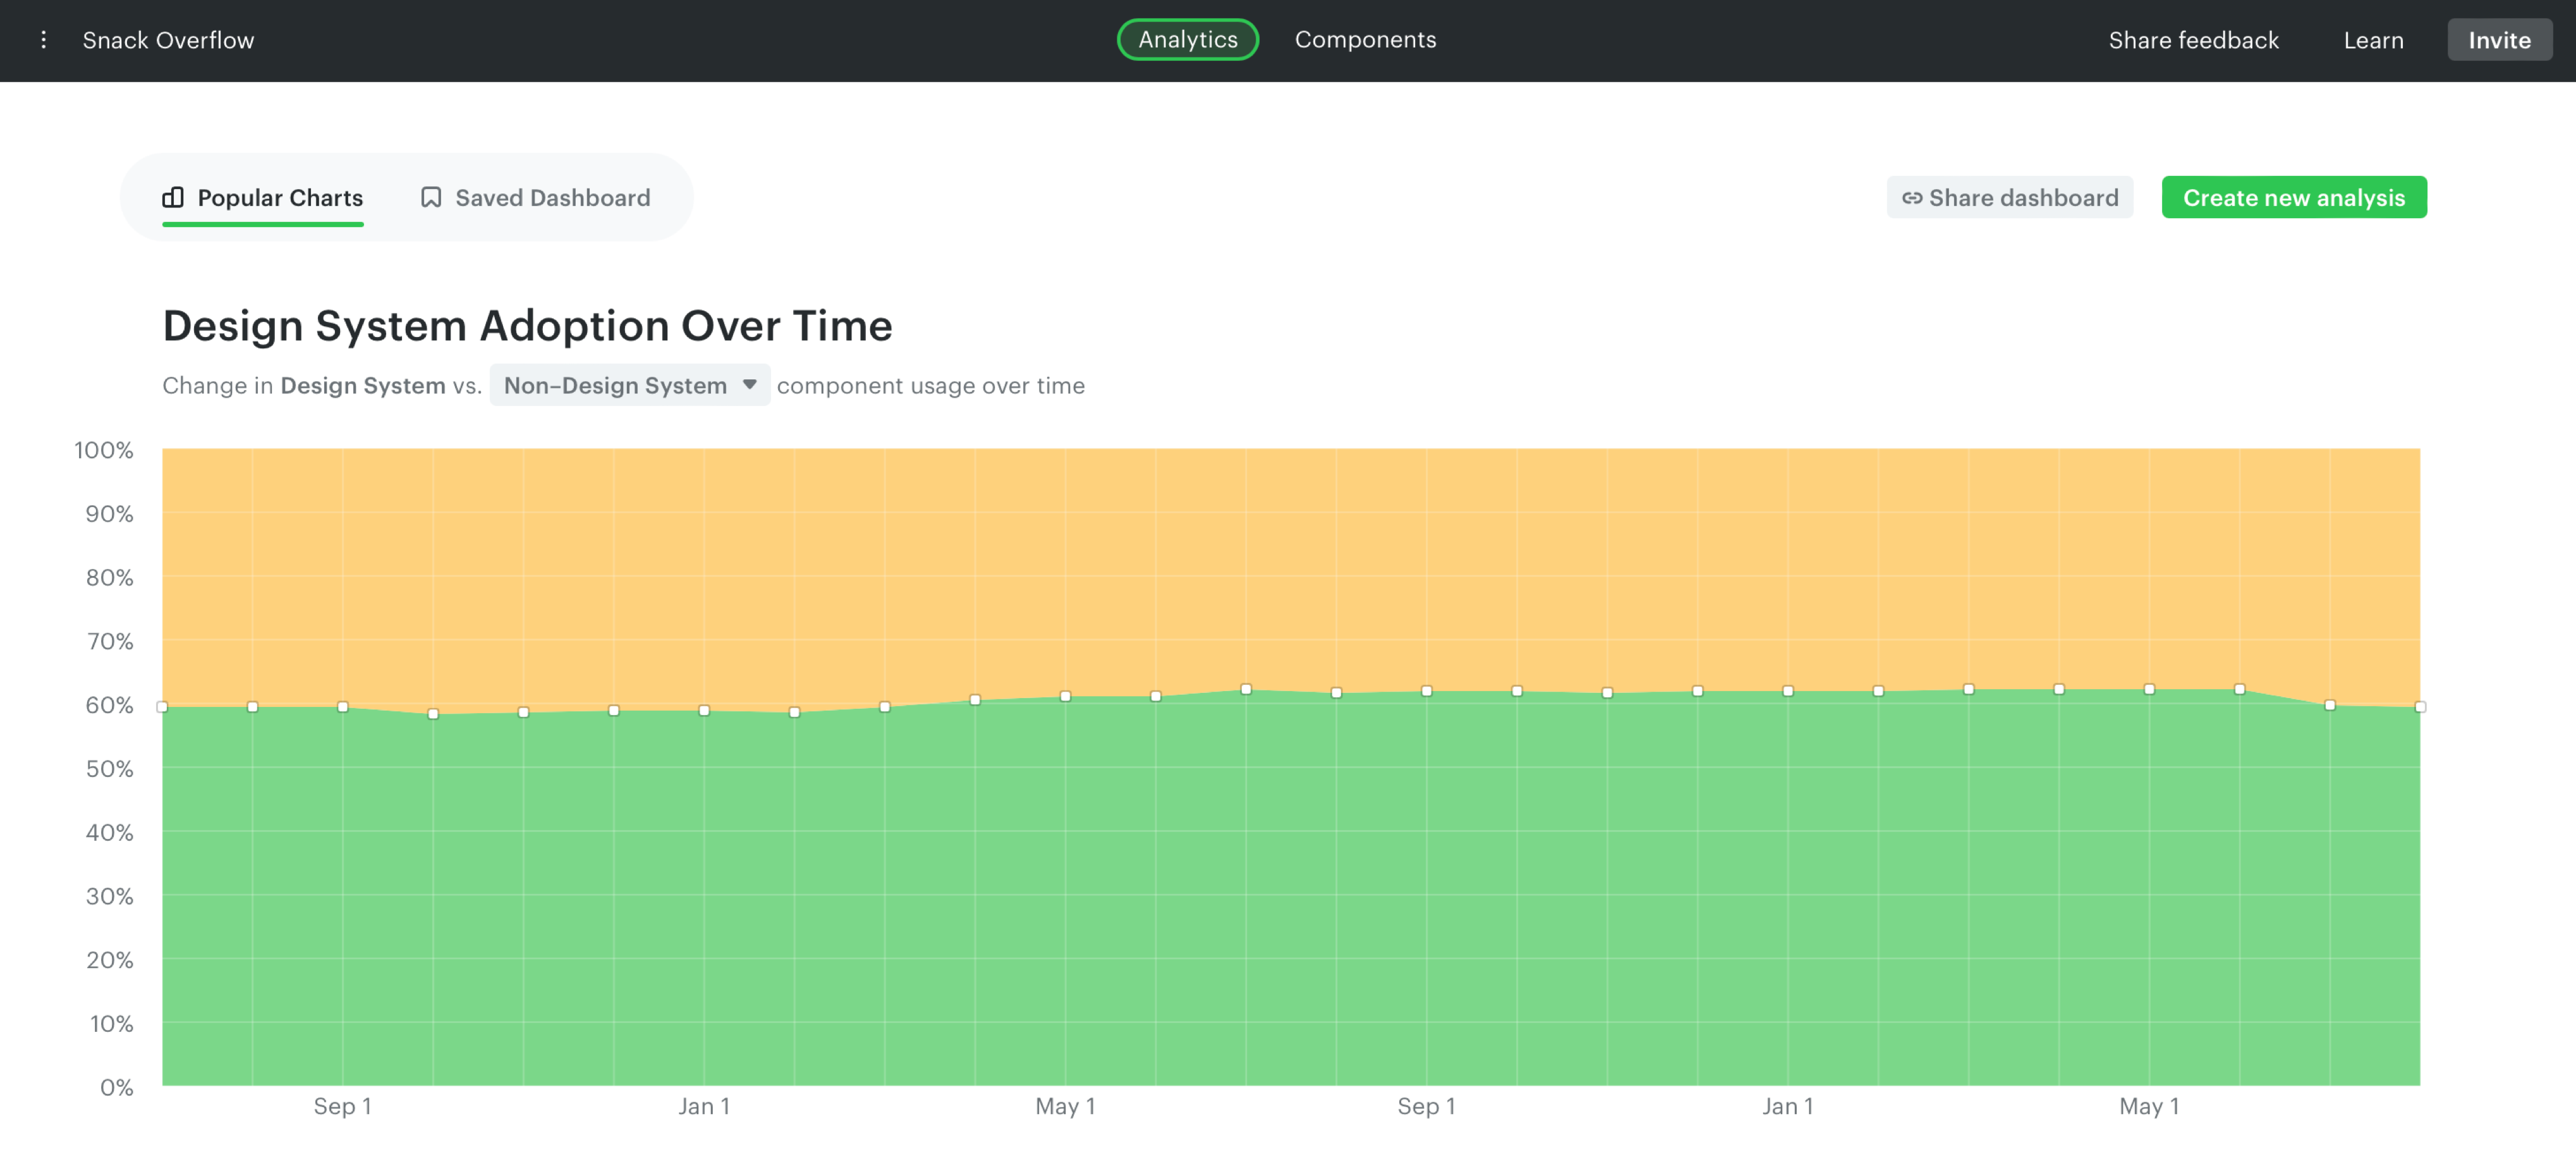
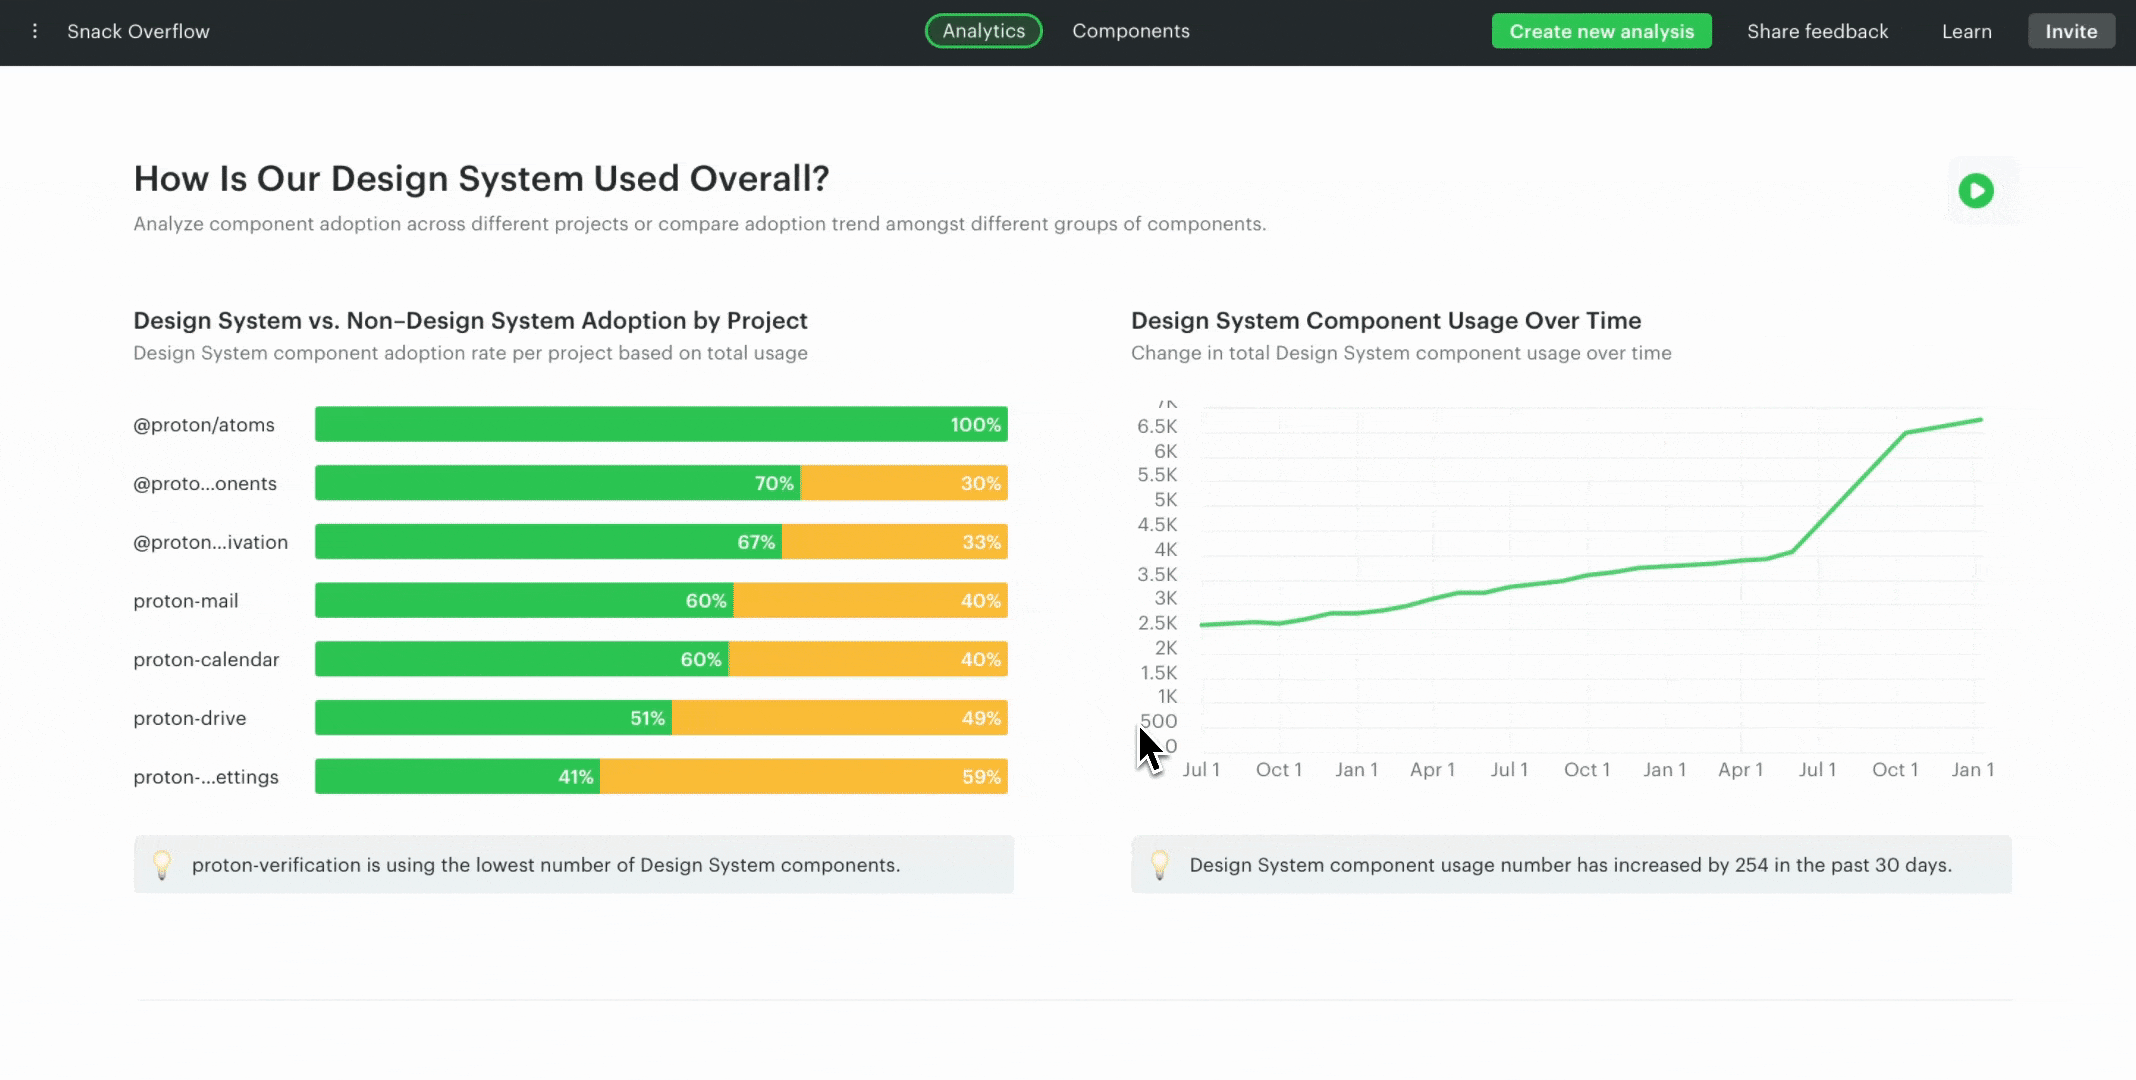
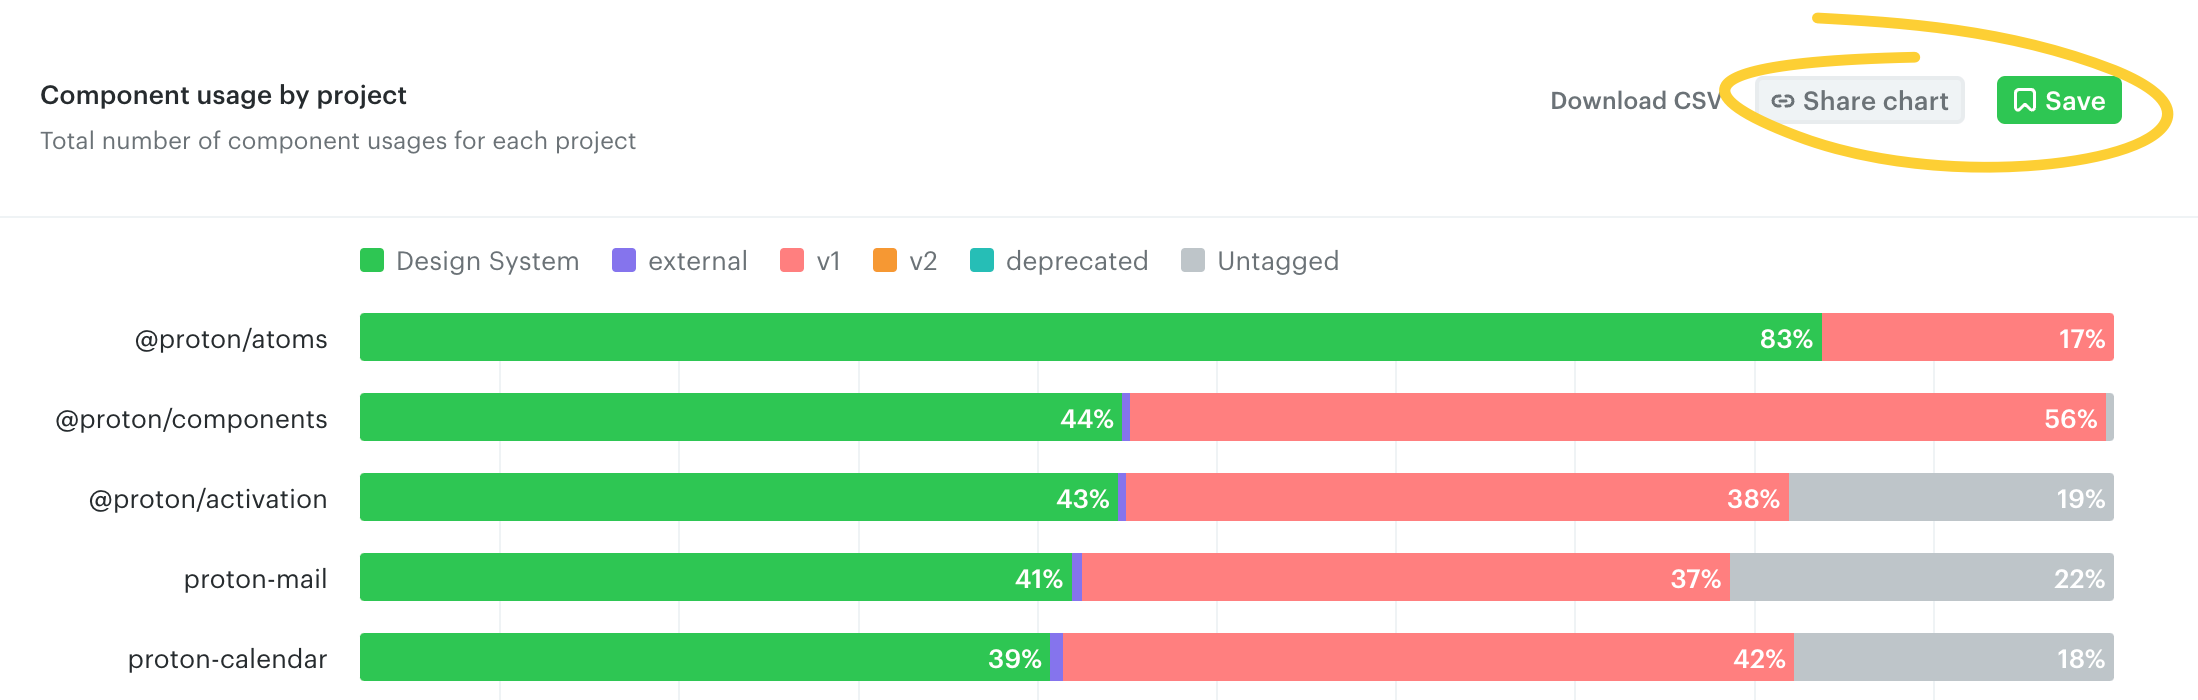
| Analytics | Learn more about the Popular Charts, create your own dashboard and use tags for custom analysis. | analytics |
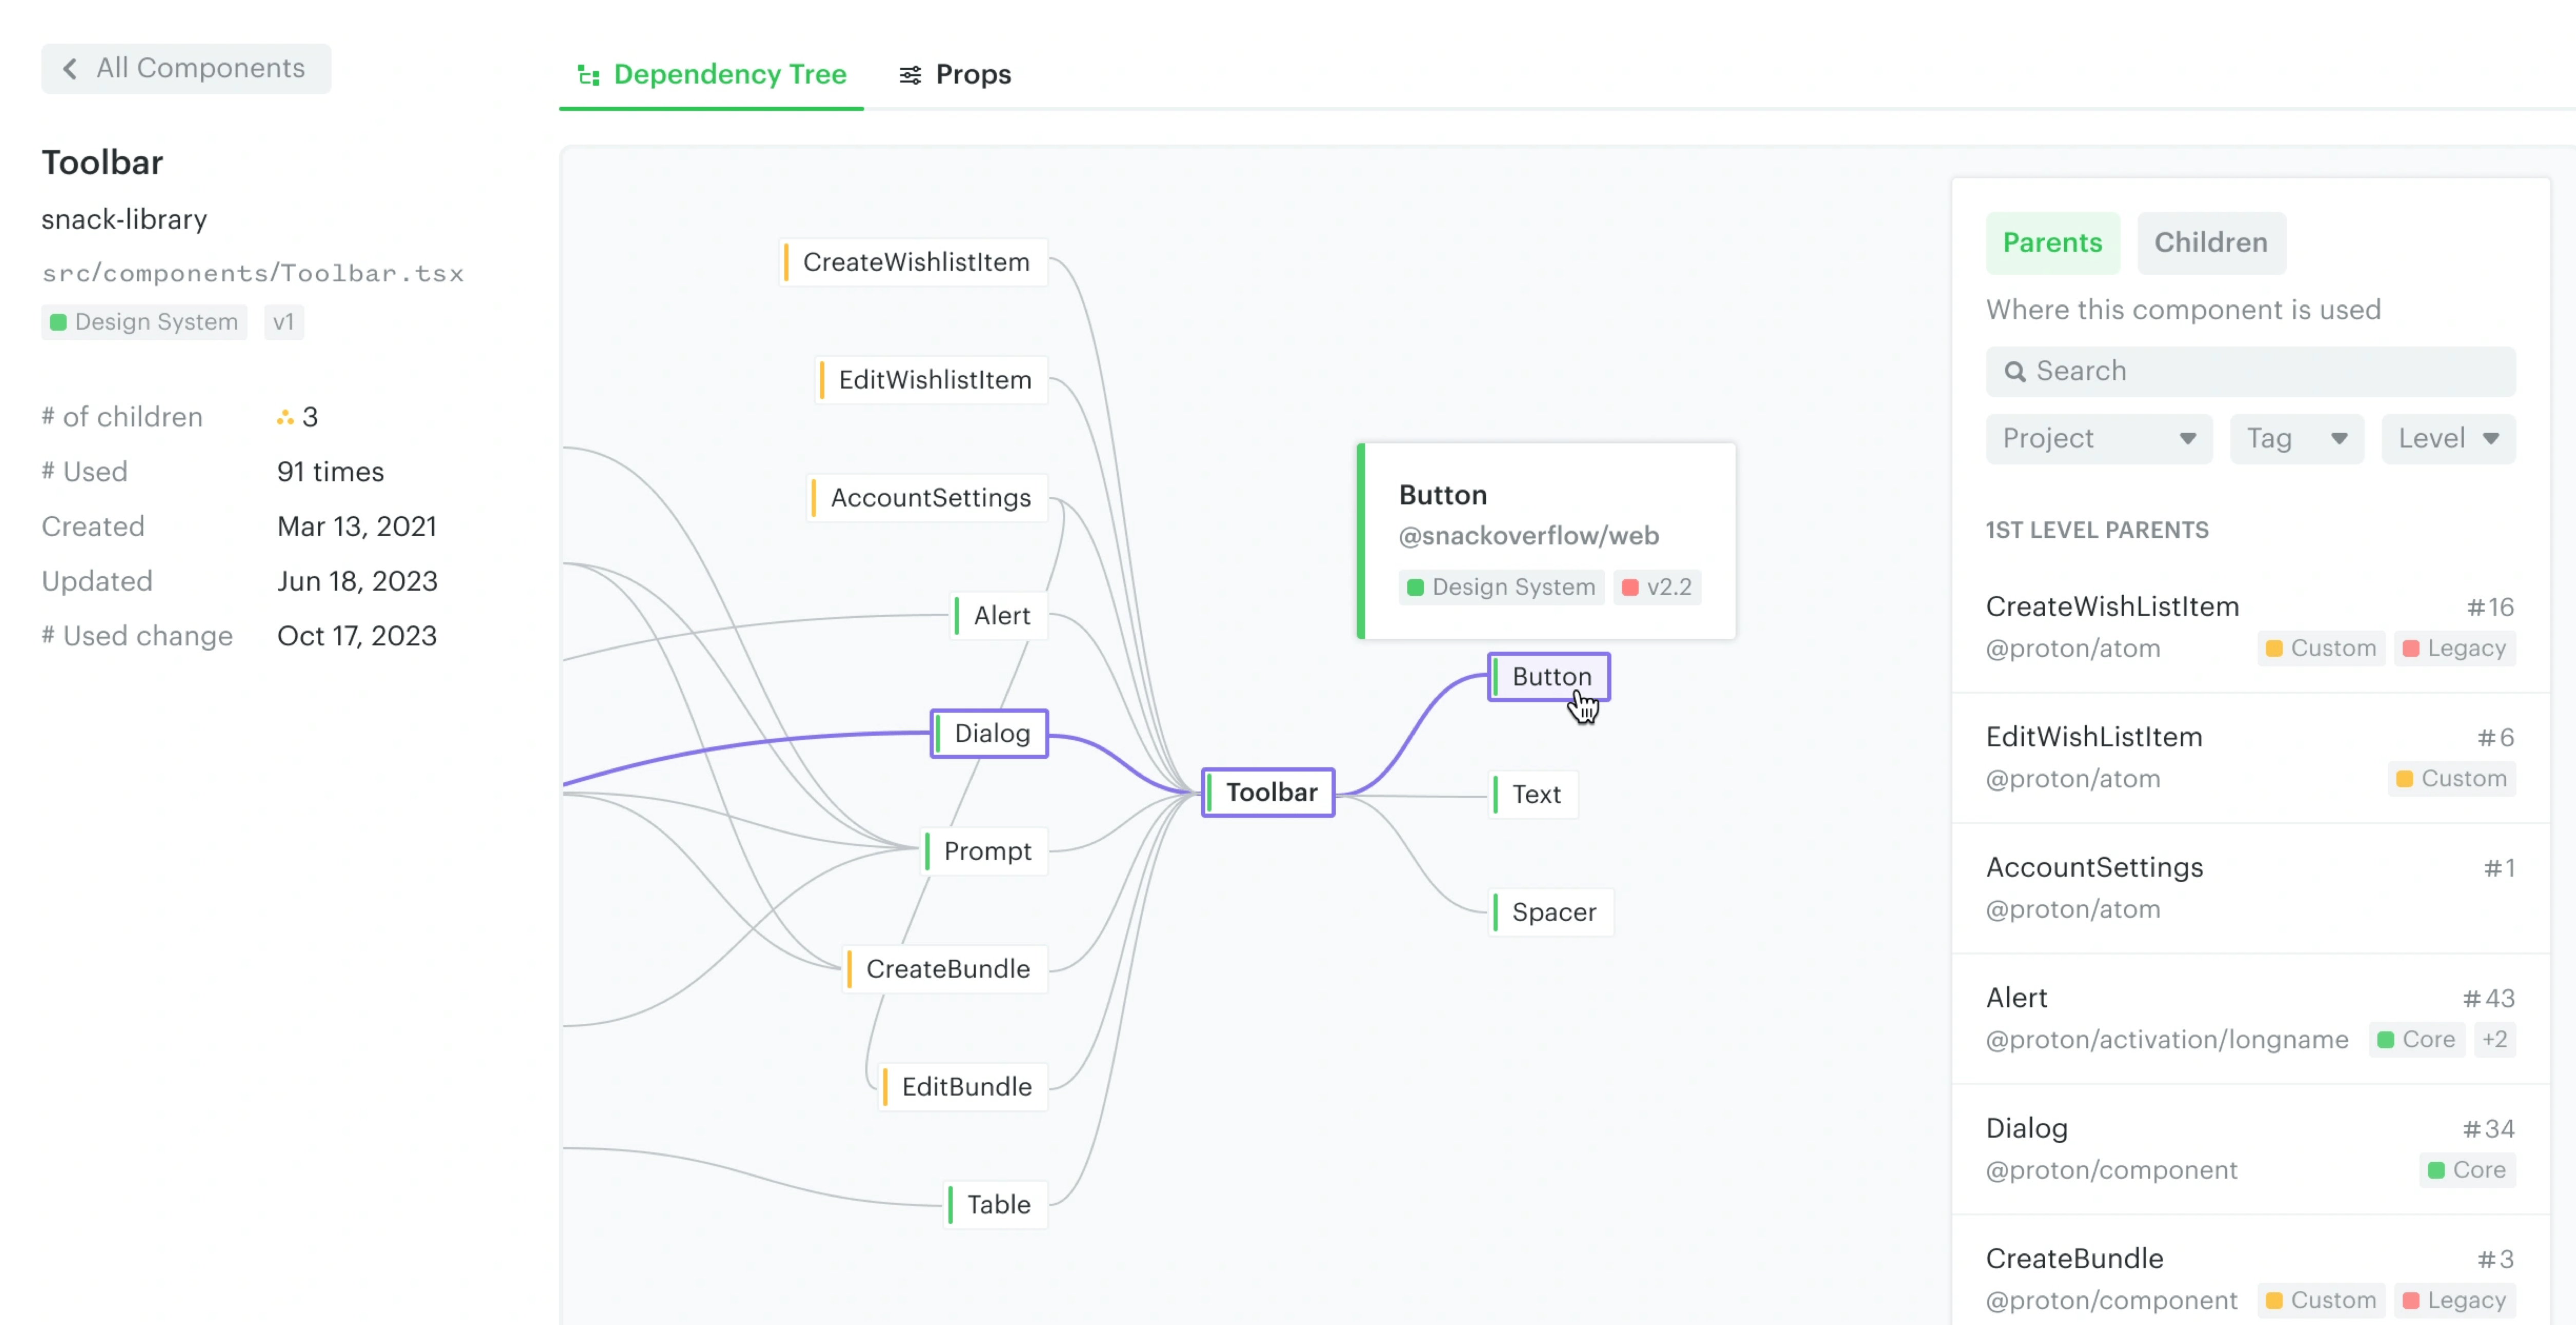
| Components | Get insights into individual components, understand the dependency tree and component props tracking. | components |
| CLI | Scan more repositories, configure CLI to your specific needs and ensure you have accurate component data. | future-scans |